Reduce, Reuse… Refactor: Clearer Elixir with the Enum Module
“When an operation cannot be expressed by any of the functions in the Enum module, developers will most likely resort to reduce/3.” From the docs for E...

For a long time I’ve been wanting to use Neo4j as a tool to analyze Ruby code. Using Ruby for almost a decade, I have a lot of experience with effectively finding my way around Ruby code. Still Ruby programs can by very dynamic and thus tools are always welcome. As I’ve begun to use Neo4j I’ve been inspired by code analysis tools such as joern and jQAssistant as well as Aaron Patterson’s heap-analyzer. In that spirit I’d like to announce a new project called Neolytics.
Neolytics is a Ruby gem which records the execution of a block of Ruby code in a Neo4j database. There are three major things which it records:
This is thanks to Ruby’s excellent TracePoint class. TracePoint gives a hook into each execution step of Ruby code so that we can record line executions, method calls/returns, and raising of executions.
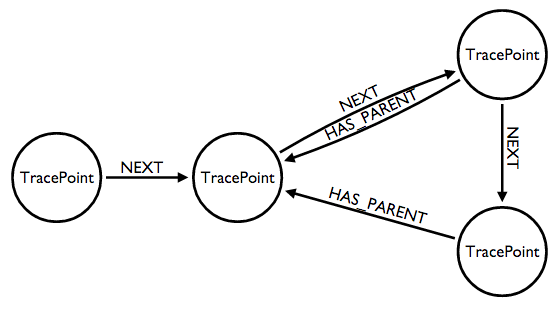
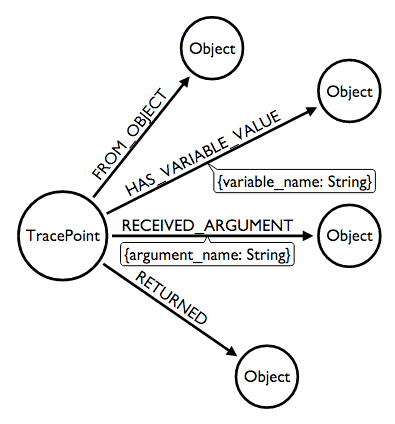
For each trace point Neolytics finds:
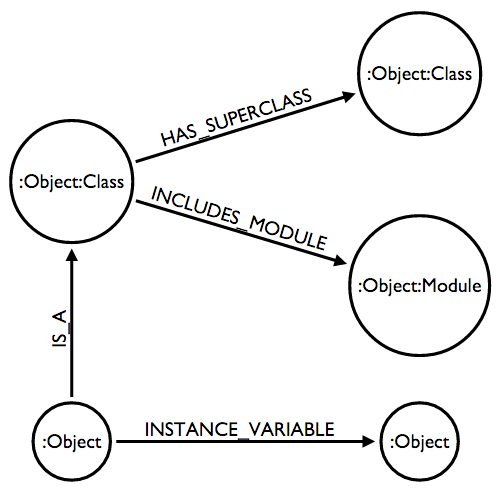
For each object the class and module ancestry information is also recursively imported.
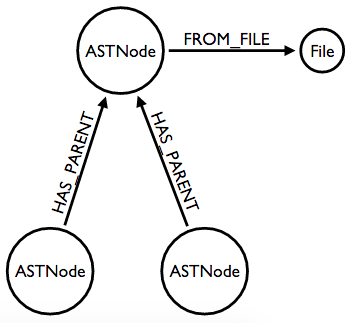
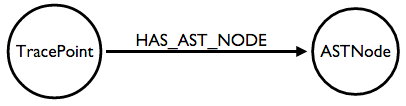
With thanks to the parser gem! Additionally method definitions in the AST are linked to their corresponding TracePoint.
To record the data, I used my neo4apis gem to send data to Neo4j efficiently without a lot of round trips to the database.
Lastly, I’ve built a ruby_code_analytics Rails application to give a UI to examine the results of the dump. You can see an example running on Heroku which is a record of the following simple Ruby code:
neo4j_session = Neo4j::Session.open(:server_db, neo4j_url)
Neolytics.record_execution(neo4j_session) do
  doc = Nokogiri::HTML(open('https://www.google.com').read)
  doc.xpath('//form/input').map(&:name)
end
Let’s look at some examples of things that you can do with the data from neolytics!
Let’s say that we want to know what goes on during the execution of a method. With the following query we grab the first TracePoint which was a call event and find the entire series of TracePoints until the method is returned from:
MATCH (call_tp:TracePoint {event: 'call'})
WITH call_tp LIMIT 1
MATCH path=shortestPath((call_tp)-[:NEXT*]->(return_tp:TracePoint {event: 'return'}))
RETURN path
Visually we can see the query like this:

In this case the method is the #plural method from the active_support gem which lets you pluralize strings. You can compare the graph database model with the actual source code here on GitHub
In the screenshot above, each node is displaying a TracePoint event (i.e. call, line, etc…), the class and method in question, and the line number. Starting from the node on the left you can follow the NEXT relationships to see each point in the execution. Note that every node has a HAS_PARENT relationship back to the call TracePoint, so we can see that this method didn’t make any further method calls (at least no Ruby calls. We see some c_call events which TracePoint doesn’t expose). Lastly note the STARTED_AT relationship from the return event to the call event which is there as a convenience for any query that need to get both nodes at once (e.g. if you need to get both the arguments and the return value of a method).
For more details you can see this example tabular output of the tracepoints.
Let’s run a query to evaluate the cyclomatic complexity of our methods:
MATCH (def:ASTNode {type: 'def'})
OPTIONAL MATCH (def)<-[:HAS_PARENT*]-(condition:ASTNode)
WHERE condition.type IN ['begin', 'if', 'while', 'until', 'for', 'rescue', 'when', 'and', 'or']
RETURN def.name, def.file_path, def.first_line, count(condition)
ORDER BY count(condition) DESC
LIMIT 10
This gives us a straightforward listing of methods, where to find them, and their complexity score, all ordered with the most complex methods at the top:
| method | Path and line | complexity |
|---|---|---|
| initialize_pattern | …/rubies/ruby-2.2.3/lib/ruby/2.2.0/uri/rfc2396_parser.rb:342 | 85 |
| validate | …/rubies/ruby-2.2.3/lib/ruby/2.2.0/rubygems/specification.rb:2453 | 65 |
| perform_arguments | …/gems/ruby-2.2.3/gems/sass-3.4.20/lib/sass/tree/visitors/perform.rb:14 | 57 |
| _next_token | …/gems/ruby-2.2.3/gems/nokogiri-1.6.7/lib/nokogiri/css/tokenizer.rb:55 | 56 |
| parse | …/gems/ruby-2.2.3/gems/tzinfo-1.2.2/lib/tzinfo/zoneinfo_timezone_info.rb:95 | 55 |
| pretty_print | …/rubies/ruby-2.2.3/lib/ruby/2.2.0/pp.rb:421 | 53 |
| merge_final_ops | …/gems/ruby-2.2.3/gems/sass-3.4.20/lib/sass/selector/sequence.rb:342 | 52 |
| call | …/gems/ruby-2.2.3/gems/sprockets-3.5.2/lib/sprockets/server.rb:22 | 48 |
| convert_input | …/gems/ruby-2.2.3/gems/erubis-2.7.0/lib/erubis/converter.rb:127 | 43 |
| visit_rule | …/gems/ruby-2.2.3/gems/sass-3.4.20/lib/sass/tree/visitors/to_css.rb:280 | 43 |
Now let’s extend this complexity metric by using the TracePoint data to see how long each method actually took:
MATCH (tp:TracePoint)
WITH sum(tp.execution_time) AS total_execution_time

MATCH (node:ASTNode {type: 'def'})
OPTIONAL MATCH (node)<-[:HAS_PARENT*]-(condition:ASTNode)
WHERE condition.type IN ['begin', 'if', 'while', 'until', 'for', 'rescue', 'when', 'and', 'or']
WITH node, count(condition) AS complexity, total_execution_time

MATCH (node)<-[:HAS_AST_NODE]-(tp:TracePoint)<-[:STARTED_AT]-(return_tp:TracePoint)

WITH
  complexity,
  total_execution_time,
  tp.path + ':' + tp.lineno + ' (' + return_tp.defined_class + '#' + return_tp.method_id + ')' AS method,
  count(tp) AS executions,
  sum(return_tp.execution_time) AS total_method_execution_time

RETURN
  method,
  complexity AS cc,
  executions AS execs,
  total_method_execution_time AS total_time,
  100.0 * (total_method_execution_time / total_execution_time) AS percentage_of_total_time,
  total_method_execution_time / executions AS avg_exec

ORDER BY total_method_execution_time DESC
LIMIT 10
With this we get a nice table of methods which take the most time, along with the cyclomatic complexity. We can sort by either metric or create a combined metric of our own in order to determine which methods might be ripe for refactoring.
| method | cc | execs | total_time | % total time | avg_exec |
|---|---|---|---|---|---|
| …/rubies/ruby-2.2.3/lib/ruby/2.2.0/set.rb:289 Set#add |
1 | 2343 | 11457 | 2.31 | 4.89 |
| …/gems/ruby-2.2.3/gems/activesupport-4.2.5/lib/active_support/inflector/methods.rb:91 ActiveSupport::Inflector#underscore |
6 | 237 | 5057 | 1.02 | 21.34 |
| …/gems/ruby-2.2.3/gems/pry-0.10.3/lib/pry/command.rb:27 #<Class:Pry::Command>#match |
4 | 810 | 4917 | 0.99 | 6.07 |
| …/gems/ruby-2.2.3/gems/pry-0.10.3/lib/pry/command.rb:43 #<Class:Pry::Command>#command_options |
2 | 641 | 3790 | 0.76 | 5.91 |
| …/gems/ruby-2.2.3/gems/pry-0.10.3/lib/pry/command.rb:177 #<Class:Pry::Command>#command_regex |
6 | 510 | 3722 | 0.75 | 7.30 |
| …/gems/ruby-2.2.3/gems/pry-0.10.3/lib/pry/command.rb:185 #<Class:Pry::Command>#convert_to_regex |
1 | 1020 | 3537 | 0.71 | 3.47 |
| …/gems/ruby-2.2.3/gems/activesupport-4.2.5/lib/active_support/dependencies/autoload.rb:35 ActiveSupport::Autoload#autoload |
4 | 233 | 3186 | 0.64 | 13.67 |
| …/gems/ruby-2.2.3/gems/sprockets-3.5.2/lib/sprockets/utils.rb:33 Sprockets::Utils#hash_reassoc1 |
4 | 115 | 2366 | 0.48 | 20.57 |
| …/gems/ruby-2.2.3/gems/activesupport-4.2.5/lib/active_support/core_ext/module/delegation.rb:151 Module#delegate |
36 | 43 | 1164 | 0.23 | 27.07 |
| …/gems/ruby-2.2.3/gems/pry-0.10.3/lib/pry/command.rb:37 #<Class:Pry::Command>#description |
2 | 152 | 1158 | 0.23 | 7.62 |
There are many ways to use this data model to debug and otherwise analyze our code. I’ve provided some more sample queries in the README for the neolytics gem. I’ve also started a list of ideas for new queries which could be made. These could be used directly or perhaps built into a reporting feature of the ruby_code_analytics Rails application. I’m excited to see where things could go!
Analysis app running on Heroku: https://ruby-neo4j-code-analysis.herokuapp.com
“When an operation cannot be expressed by any of the functions in the Enum module, developers will most likely resort to reduce/3.” From the docs for E...
Elixir allows application developers to create very parallel and very complex systems. Tools like Phoenix PubSub and LiveView thrive on this property of the ...
(This post was originally created for the Erlang Solutions blog. The original can be found here)
with It, Can’t Live without It
(This post was originally created for the Erlang Solutions blog. The original can be found here)
I’ve been using Elixir for a while and I’ve implemented a number of GenServers. But while I think I mostly understand the purpose of them, I’ve not gotten t...
I love Lodash, but I’m not here to tell you to use Lodash. It’s up to you to decide if a tool is useful for you or your project. It will come down to the n...
I’ve mix phx.new ed many applications and when doing so I often start with wondering how to organize my code. I love how Phoenix pushes you to think about th...
What can a 50 year old cryptic error message teach us about the software we write today?
For just over a year I’ve been obsessed on-and-off with a project ever since I stayed in the town of Skibbereen, Ireland. Taking data from the 1901 and 1911...
Recently the continuous builds for the neo4j Ruby gem failed for JRuby because the memory limit had been reached. I wanted to see if I could use my favorite...
A while ago my colleague Michael suggested to me that I draw out some examples of how my record linkage algorithm did it’s thing. In order to do that, I’ve ...
Last night I ran a very successful workshop at the Friends of Neo4j Stockholm meetup group. The format was based on a workshop that I attended in San Franci...
In my last two posts I covered the process of importing data from StackOverflow and GitHub for the purpose of creating a combined MDM database. Now we get t...
In my last post I said I would “bring in another data source, show how I linked the data together, and demonstrate the sort of bigger picture that one can ge...
Joining multiple disparate data-sources, commonly dubbed Master Data Management (MDM), is usually not a fun exercise. I would like to show you how to use a g...
I have a bit of a problem.
When using neo4j for the first time, most people want to import data from another database to start playing around. There are a lot of options including LOA...
Having recently become interested in making it easy to pull data from Twitter with neo4apis-twitter I also decided that I wanted to be able to visualize an...
I’ve been reading a few interesting analyses of Twitter data recently such as this #gamergate analysis by Andy Baio. I thought it would be nice to have a ...
I am he as you are he as you are me and we are all together – The Beatles
When I told the people of Northern Ireland that I was an atheist, a woman in the audience stood up and said, ‘Yes, but is it the God of the Catholics or t...
“Wilkins! Yes! I’ve considered decorating these walls with some graffiti of my own, and writing it in the Universal Character.. but it is too depressing...